When working with datasets, data scientists and data analysts use Exploratory Data Analysis (EDA) to gain insights and understand the data. EDA involves analyzing and summarizing the data to identify patterns, anomalies, and hypotheses through visualization and examination.
The main objectives of EDA are to:
- Understand the data: it helps you become familiar with the dataset by examining its structure, variables, and relationships, including identifying the types of variables and overall distribution.
- Identify patterns and relationships: it allows you to explore the relationships between variables by examining correlations, associations, and trends using visualizations like scatter plots, histograms, and heat maps.
- Detect anomalies and outliers: it helps identify any unusual or extreme observations in the dataset that could affect analysis or modeling.
- Formulate hypotheses and insights: it generates hypotheses and observations about the data that guide further analysis or predictive modeling.
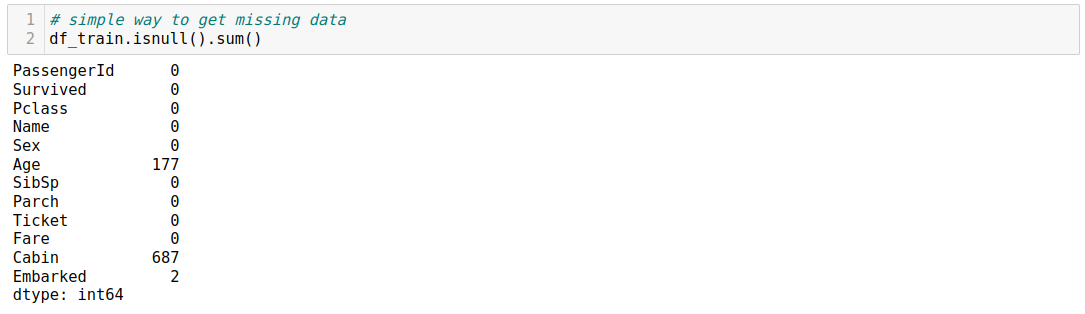
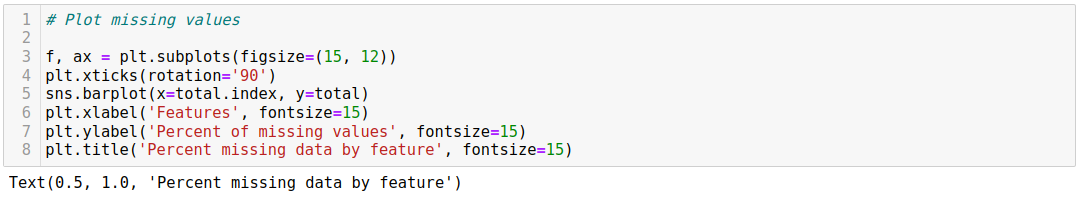
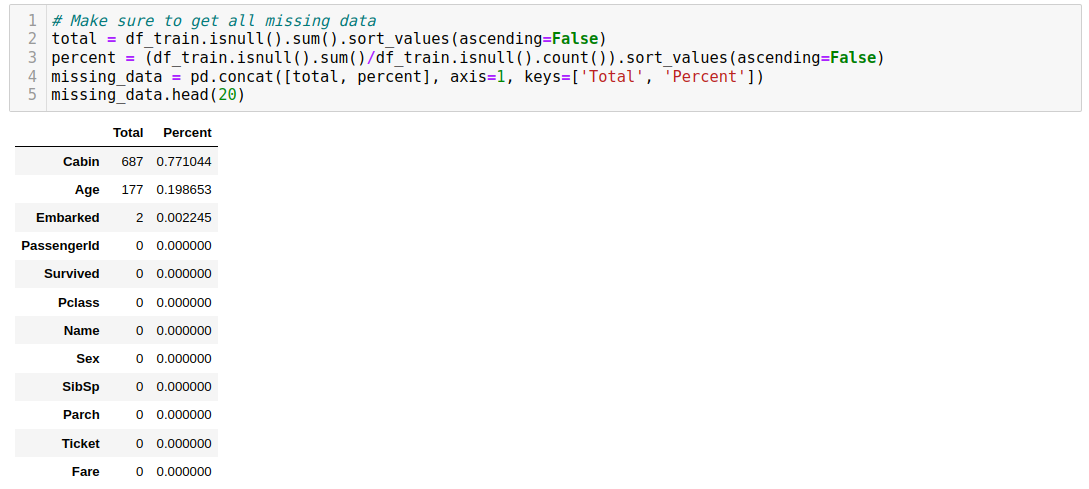
- Assess data quality and suitability: it evaluates data quality, including identifying missing values, errors, and inconsistencies, and determines whether the dataset is appropriate for the intended analysis or if additional data is necessary.
EDA techniques include summary statistics, data visualization, correlation analysis, data transformation, and statistical modeling. Commonly used tools for EDA include Python libraries like Pandas, NumPy, Matplotlib, Jupyter Notebooks, and RStudio.

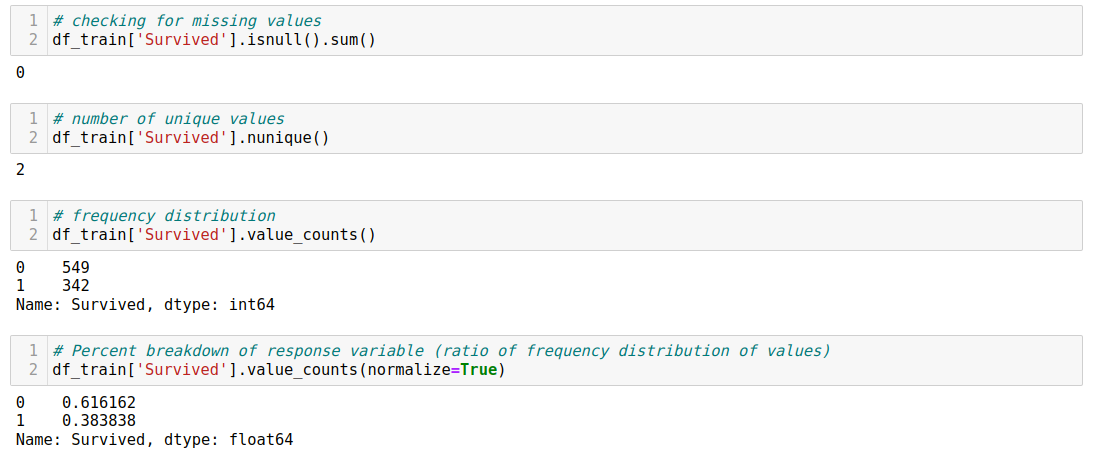
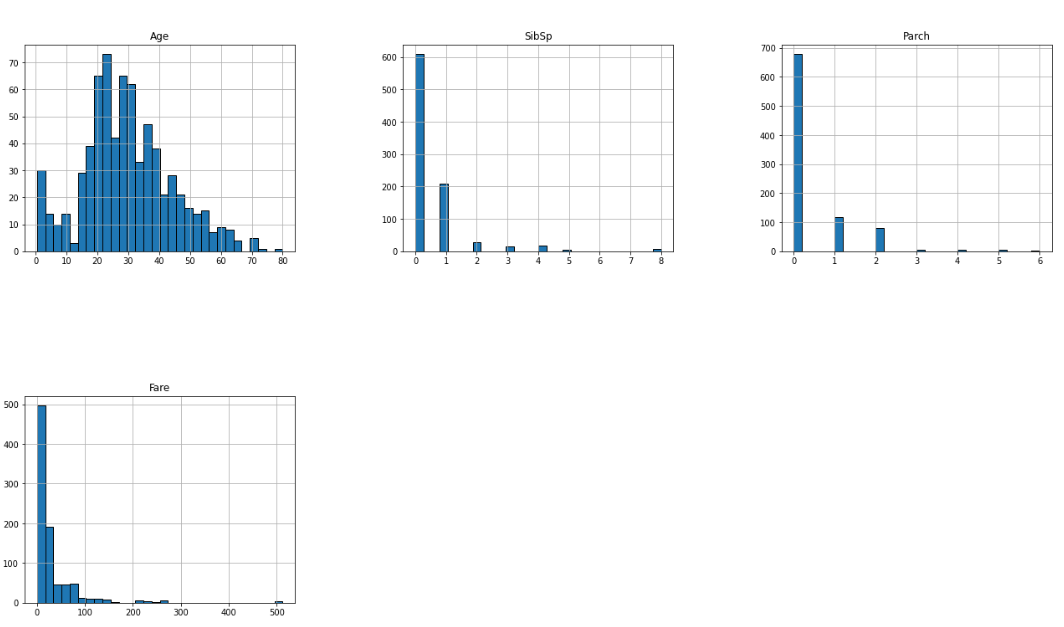
Two main techniques are used when analyzing data: univariate analysis and bivariate analysis. The univariate analysis examines a single variable in isolation, exploring its distribution, central tendency, dispersion, and other characteristics. On the other hand, bivariate analysis focuses on examining the relationship between two variables simultaneously, exploring the association, correlation, or dependency between them.
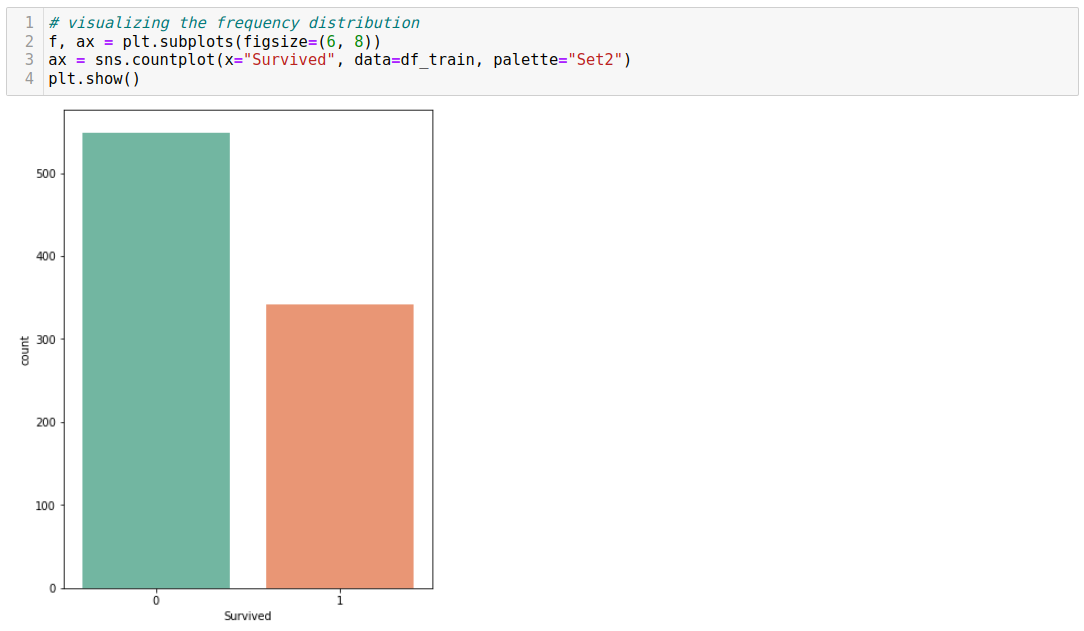
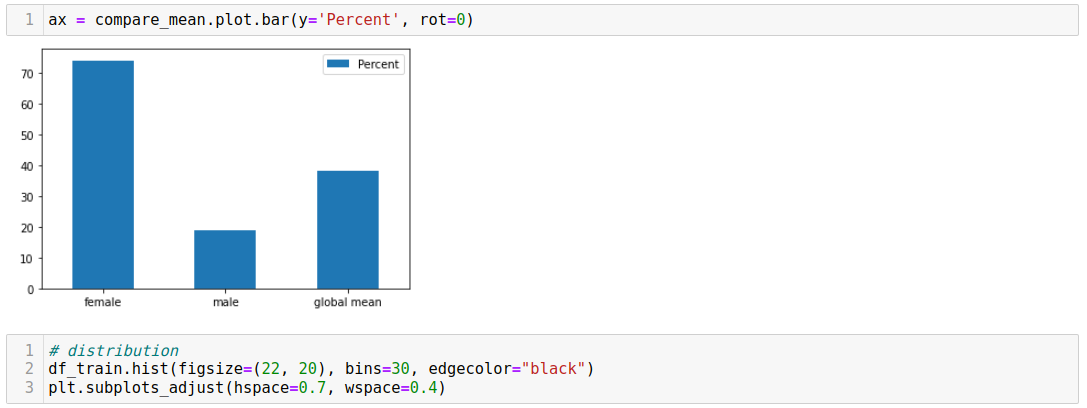
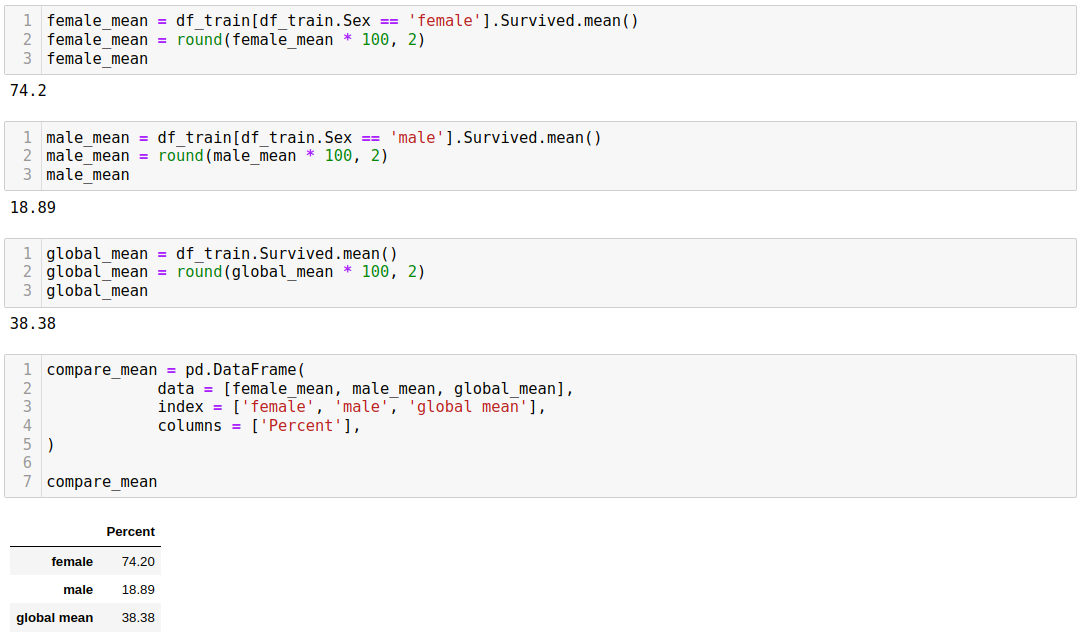
For numerical continuous variables, we can use a histogram or scatter plot. For categorical data, we commonly prefer bar plots or pie charts.


The primary goals of bivariate analysis are to assess the relationship between two variables, understand the nature of that relationship (whether it is linear, nonlinear, positive, negative, or no relationship at all), quantify the strength and direction of the relationship, visualize the relationship through various visualizations like scatter plots and heat maps, and make predictions based on one variable's values and their relationship with another.
Bivariate analysis techniques include correlation analysis, regression analysis, contingency tables, chi-square tests, and scatter plots. These techniques can help uncover meaningful insights and guide further analysis, such as multivariate analysis, where the relationship between more than two variables is examined simultaneously.

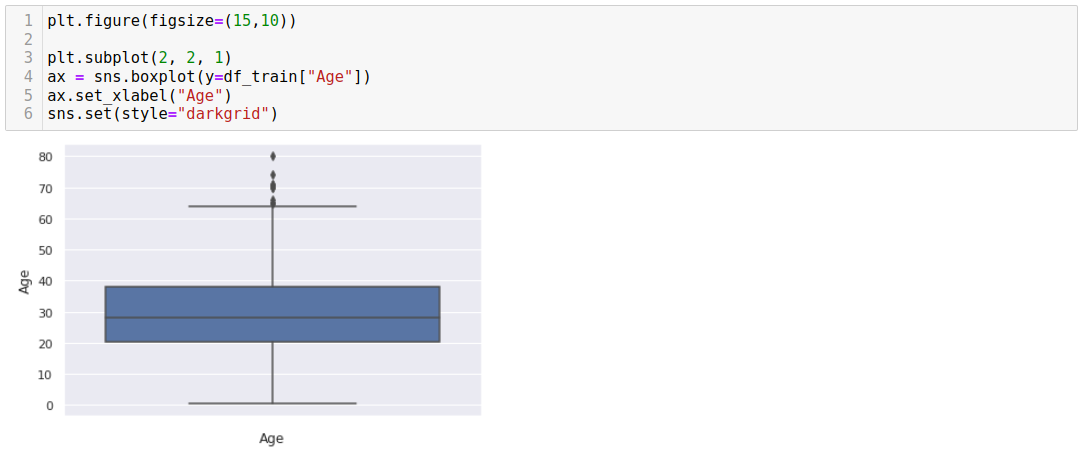
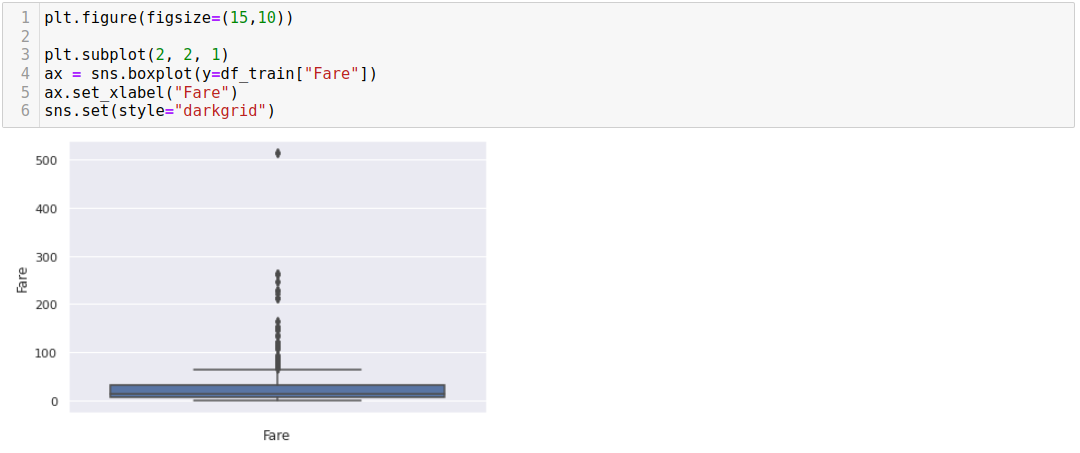
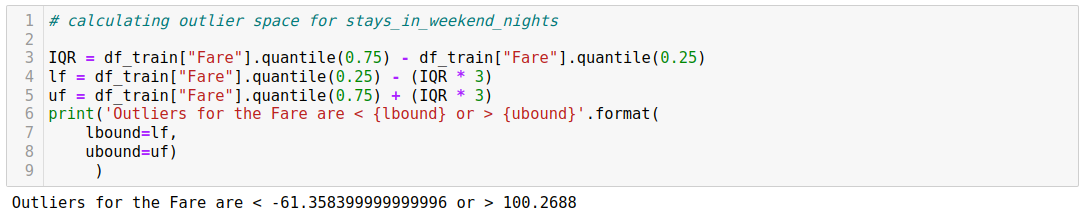
In machine learning, outliers are data points that significantly deviate from the normal or expected behavior of the majority of the dataset. Outliers are observations that are distant from other observations and may exhibit unusual characteristics or behaviors compared to the rest of the data. These observations can have a significant impact on the analysis and modeling process.
Outliers can arise for various reasons, including measurement errors, data entry errors, rare events, or genuinely extreme values in the studied phenomenon. Identifying and handling outliers appropriately in machine learning tasks is important to ensure reliable and accurate modeling results.
Here are some key points about outliers in machine learning:
- Impact on Data Analysis: Outliers can skew statistical measures such as the mean and standard deviation, affecting the distribution and central tendency of the data. They can also distort correlation and covariance estimates, potentially leading to erroneous conclusions and modeling assumptions.
- Impact on Models: Outliers can significantly impact machine learning models. They can influence parameter estimation, bias the model towards the extremes, and reduce its predictive accuracy. Outliers can also affect the decision boundaries in classification tasks, leading to suboptimal performance.

Enhancing machine learning models' performance and predictive power involves feature engineering, modifying, or creating new input features. This process is crucial in machine learning, as features' quality and relevance significantly impact the model's accuracy, interpretability, and generalization ability. Feature engineering involves transforming raw data into a suitable representation that captures relevant information and patterns, enabling the model to learn effectively.
Some common techniques and strategies used in feature engineering include feature transformation, feature construction, feature selection, and feature improvement.
It's important to note that feature engineering requires a deep understanding of the data, problem domain, and modeling techniques being employed. It often involves an iterative experimentation, analysis, and refinement process to identify the most effective features for the task while considering potential impacts on model interpretability, computational complexity, and overfitting.

Common transformations include scaling features to a specific range (e.g., using min-max scaling or standardization), applying logarithmic or power transformations, or converting categorical variables into numerical representations (e.g., one-hot encoding or ordinal encoding).
Our goal is to transform a feature on the nominal level and create a one-hot encoding matrix, where each feature represents a distinct category, and the value is either 1 or 0, representing the presence of that value in the original observation.


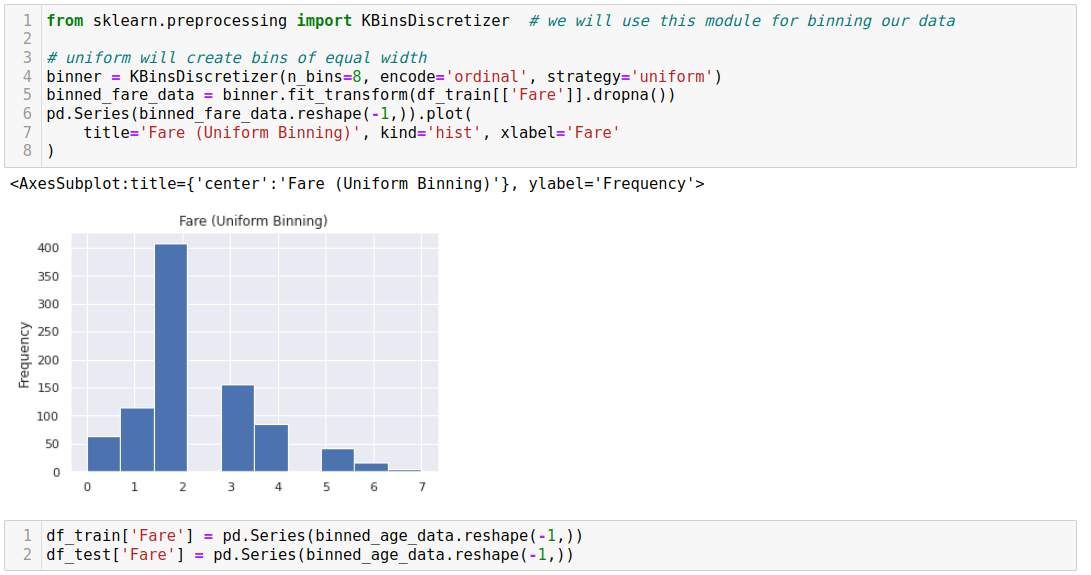
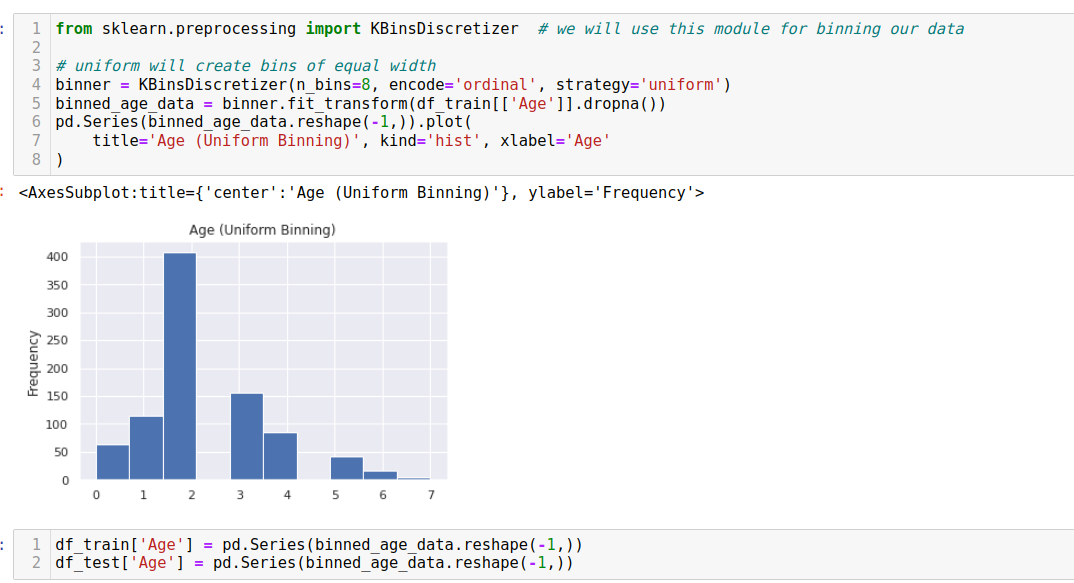
Binning refers to grouping numerical data into bins based on threshold cutoffs to reduce the model's chance of overfitting the data.
Feature construction involves creating interaction features or augmenting the dataset by creating new interpretable features from existing ones. Feature selection aims to identify and select the most informative and relevant features for the model to reduce dimensionality and enhance interpretability.

Feature improvement involves making existing features more usable through mathematical transformations or imputing missing numeric data.

Data processing and feature engineering are the most important steps in a machine learning project. They allow us to understand better the data and perform transformations to prepare the data for modeling.